Fotokiklosi Waste Management Platform
Built as a production system for an enterprise client, with a focus on reliability, clear workflows, and a UI tailored to the way people actually work day-to-day.
What we were solving
Context & problem
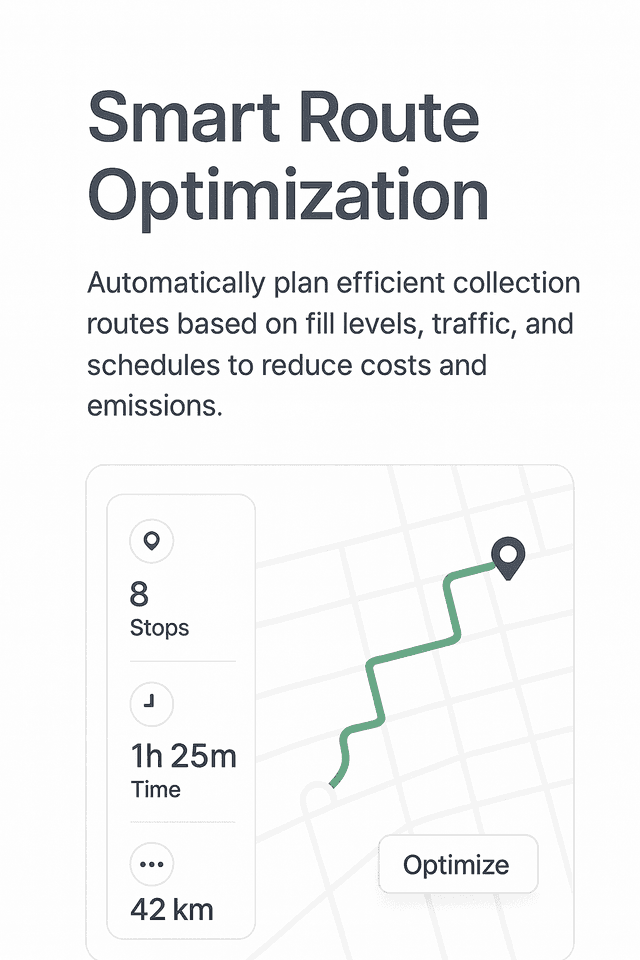
Municipalities and partners needed a clear view of how waste moved across collection points, routes, and materials. In practice, information lived in paper logs, phone calls, and disconnected spreadsheets, making it hard to answer basic questions like: which points are full, which routes are inefficient, and how materials translate into transactions.
The goal was to replace this fragmentation with a single system that operators, drivers, and administrators could all rely on, with real-time visibility and auditable records.
How we approached it
Solution
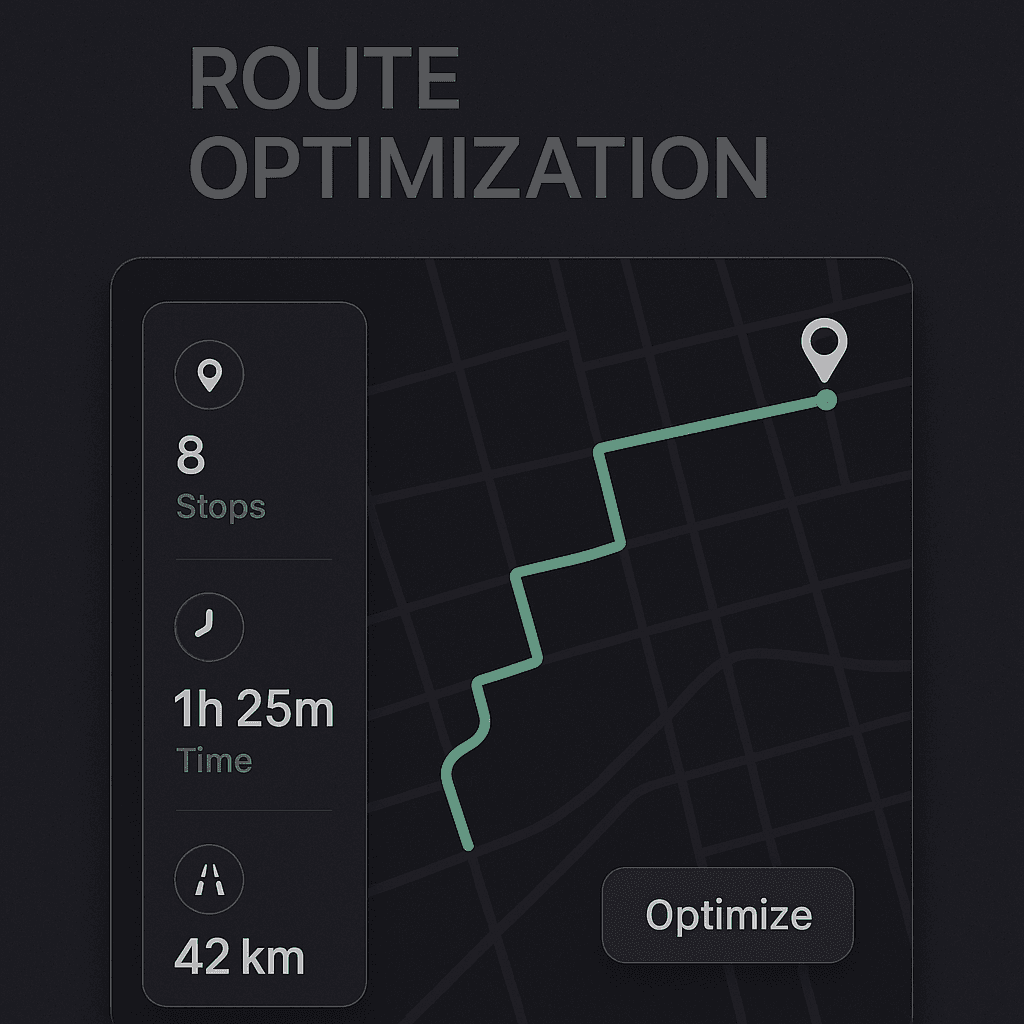
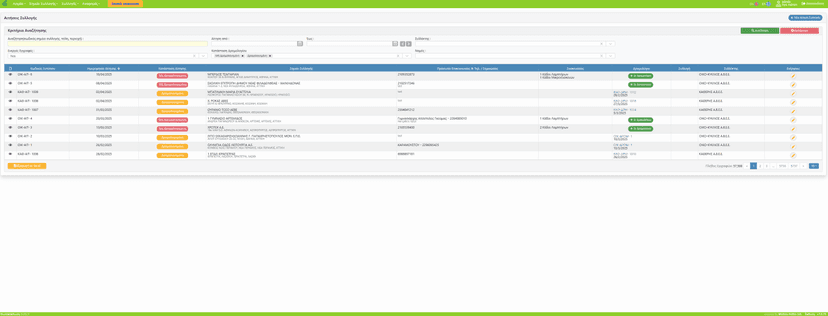
As lead engineer, I worked closely with domain experts to model the real-world concepts of the network: collection points, containers, routes, materials, and transactions. From there, we designed a web platform that gives operators a live map of activity, and back-office users a set of tools for tracking flows and generating reports.
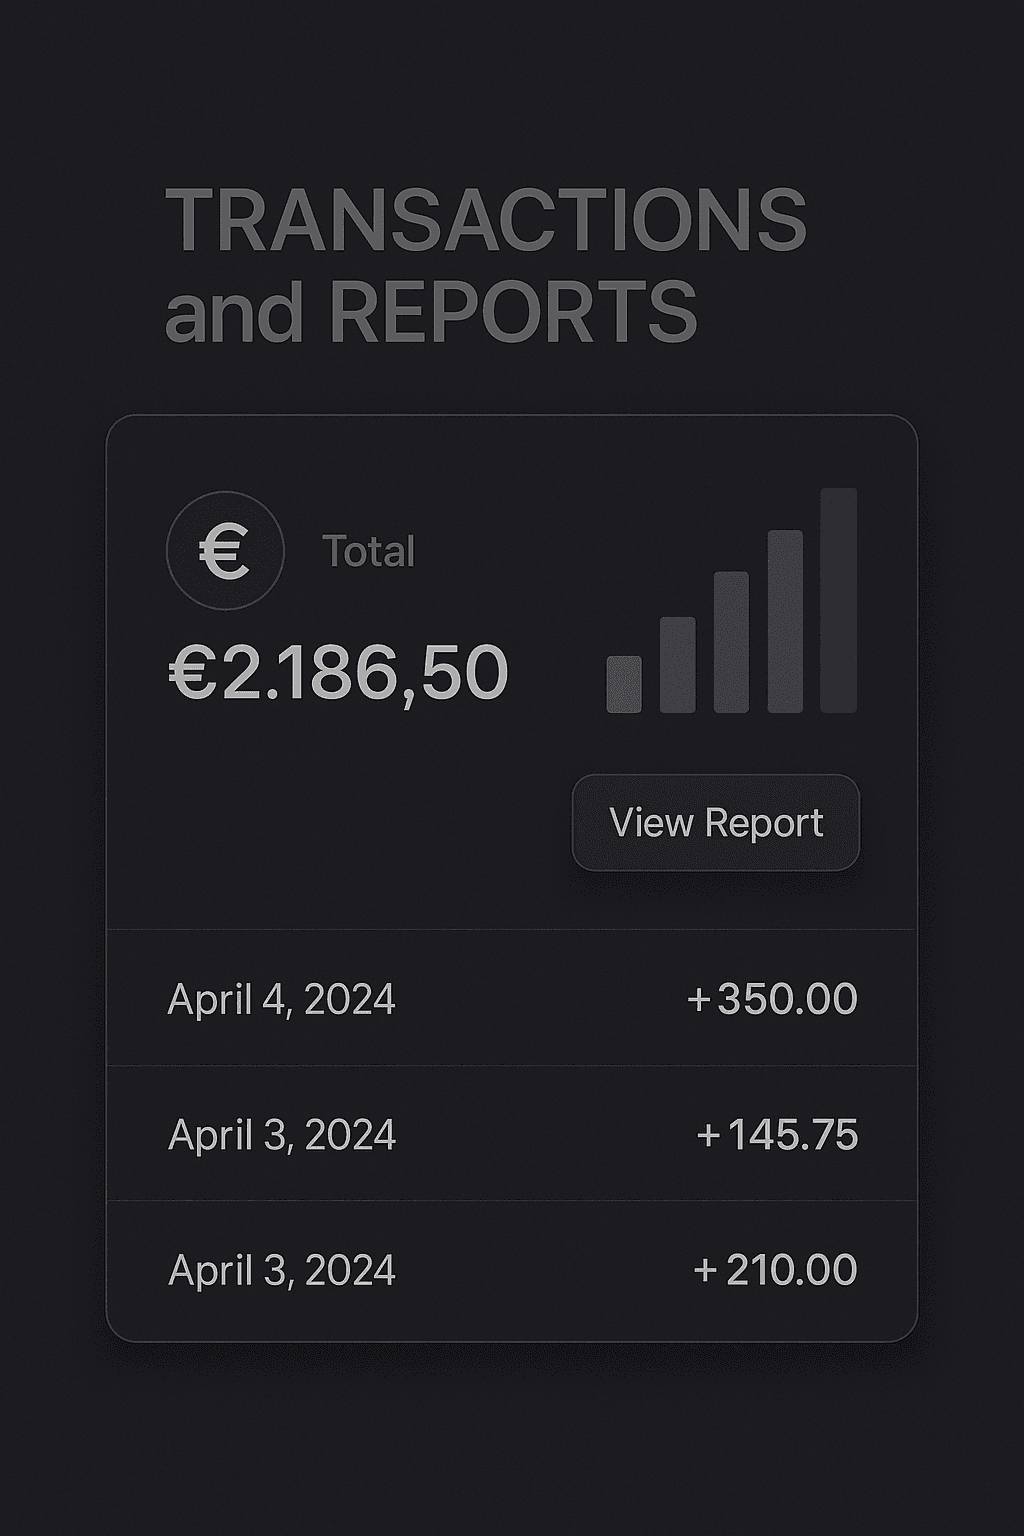
The product emphasises clarity and trust in the data: every movement is recorded, every transaction is traceable, and the system surfaces the information different roles care about without overwhelming them.
Impact
Outcomes
- - A single platform to track collection points, routes, and materials across regions, reducing reliance on manual status checks.
- - Clear internal transaction history that makes audits and compliance reporting easier to handle.
- - Shared operational view between field teams and back office, improving coordination and reducing miscommunication.
- (Quantitative metrics can be added here once they are available.)